

Categories
Multi-Hazard Risk Analysis Methodologies
This study is conducted by two Masters students, Laura Hielkema (intern at 510) and Jasmijn Suidman (Junior Research at the Red Cross Red Crescent Climate Centre), in collaboration with the Red Cross Red Crescent Climate Centre (supervised by Catalina Jaime, Climate and Conflict Manager), and 510. A study into multi-hazard risk methodologies has been conducted as part of a project commissioned by the World Bank to identify Drivers of Climate and Environmental Fragility in Burundi.
1. Introduction
The reality of the COVID19 crises has highlighted once more the need for thinking about disasters not as isolated and static events, but as a realization of one of the multiple hazards that may affect a specific area. Climate events that are not extreme in itself can nevertheless lead to extreme impact when occurring simultaneously with other (non-extreme) events. Taking a single-hazard approach would be at risk of underestimating the potential risk a certain region faces. Hence, there is a general agreement that disaster risk reduction needs to move from single to multi-hazard scenarios. A multi-hazard approach can help policymakers and investors to decide where to channel money and attention to, making development efforts and hazard response risk-informed and more efficient.
1.1 Moving from single to multi-hazard analysis
Moving from single to multi-hazard analysis is not an easy task, either for the scientific community as for the operational decision makers within the institutions and organizations managing and mitigating the hazard. Challenges identified in literature are the fragmentation complexity of multi-hazard events and their interrelations, the gaps in multi-hazard approaches taken by different institutions and the complexity of multi-hazard events that may lead to a wealth of ad-hoc solutions. Not only the extremeness of a climate or weather variable determines the impact, rather the exposure and vulnerability of people should be well understood too.
A multi-hazard approach tries to capture a complex and non-stationary system in one assessment. This can only happen if there is interdisciplinary collaboration between knowledge institutions and operational decision-making agencies. As impacts do not adhere to silo’s, the international operational community warns that multi-hazard consequences and solutions should not be investigated in silo’ either.
1.2 Terminology
Multi-hazard risk analysis is a broad term encompassing the examination of the hazards in a specific geographic area and time and their magnitude as well as the description of their interaction and the interpretation of their compounding outcomes on a target group. It expands on single-hazard analysis and its outcomes are not just the sum of its parts.
- ‘Multi-hazard’ refers to situations with more than one hazard at a time (and they are potentially interacting with each other).
- When the magnitude of the hazard is particularly high from a statistical perspective, or surpasses a specific threshold the hazard is classified as ‘extreme’.
- ‘Compound hazards’ are a specific category of multi-hazard where: “(a) extremes that occur simultaneously or successively; (b) extremes combined with background conditions that amplify their overall impact; or (c) extremes that result from combinations of “average” events” (Pescaroli & Alexander, 2018, p. 6). Within the realm of multi-hazard risk analysis, the term ‘compounding hazard’ is often used in reference to weather and climate hazard.
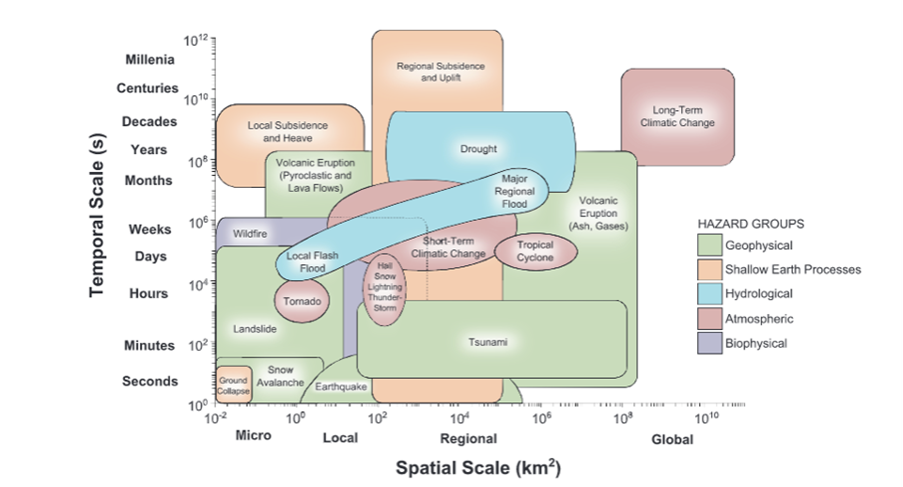
It is important to observe that when moving from single hazard to multi-hazard analysis, the temporal and spatial scale of the risk at hand may drastically change. Also, since hazards interact, the combination of two or more single hazard does not result in a linear relationship with the resulting impacts.
Types of interrelations between hazards:
- Independence -> Pure coincidence. Both spatial and temporal overlay of the impacts of two hazards, but no triggering or dependence relationship.
- Triggering or cascading -> Primary and a secondary hazard. Any hazard might trigger zero, one or more hazards. The second hazard might be the same or different.
- Change conditions -> A hazard could alter the disposition of a consecutive hazard by altering the environmental conditions.
- Compound hazard (association) -> Interrelated different hazards that are caused by the same primary event or large-scale processes (not hazards necessarily).
- Mutual exclusion or negative dependence of two natural hazards can also exhibit.
The relationship between hazards considered may influence the choice of the methodology (e.g. cascading hazards versus simultaneous but independent hazards). While the methodology chosen for the risk analysis is applicable to multiple types of hazards, there may be methodologies more suitable than others depending on the type of interaction that exist between hazards. It is therefore advised to first understand the interrelations between the hazard and then choose the methodology (or combination of methodologies) for multi-hazard risk analysis.
2. Methodologies
Multi-hazard risk analysis methodologies can be divided into qualitative, quantitative and semi-quantitative methodologies.
2.1 Qualitative methodologies
Simultaneous but independent hazards are difficult to quantify as there is not a (causal, demonstrated) dependence between the two events and therefore them happening at the same time may be the realization of a random process. In these cases, turning to qualitative methodologies might be the best practice. Qualitative methodologies are useful to define the scope of disasters to focus on during a multi-hazard study, and to understand for example which combination of disasters leads to the highest impact on the target communities.
Descriptive or anecdotical methodologies have been used to discursively describe the relationship between primary and secondary hazards. Other qualitative methodologies do not aim to quantify the risk from multi-hazards but rely on visualization to provide information on potential spatially and temporally overlapping or subsequential hazards. Geographical multi-layer hazard approaches have been used to identify on a map areas of potential spatial overlapping of hazards (see for example: Dilley, et al., 2005; Wipulanusat et al., 2009; Mahendra et al., 2011).
Data on past historical occurrences of such simultaneous events, expert knowledge, and interviews can be used within qualitative methodologies. A limitation is that completeness and quality of data collected this way is highly dependent on the number of participants, and the selection bias on the interviewed sample. The informant and interviewer’s ability to understand the hazard and to give objective answers is also considered a limitation.
See this ACAPS report for an example.
Qualitative analysis can be translated into more quantitative results by facilitating a mapping between discursive perceptions and quantitative measures such as ranking on a scale. Pairwise ranking is a commonly used technique in these cases. Community mapping also is a technique often used to translate anecdotes to geographical mapping.
2.2 Quantitative methodologies
Quantitative methodologies focus on quantifying the magnitude of the hazards and the interrelations between the hazards, and is often used to assess the occurrence of potential cascading hazards by modeling analytically the cause-effect chain and deriving the probability distribution of its occurrence.
Quantitative methodologies are broadly divided into multi-layer single-hazard approaches, and multi-hazard approaches that integrate interactions between environmental and anthropogenic processes.
2.2.1 Multi-layer single-hazard approaches
Multi-layer single-hazard approaches focus on identification of areas where hazards overlap. This is done by super imposing hazard layers. The interrelations between hazards are not considered, which reduces the reliability. However, many different hazards can be included. This methodology is easy to understand, and the results are easy to interpret and can deal with a lot of risk information.
Risk Frequency Maps
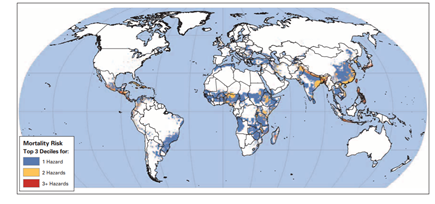
The simplest quantitative methodology for a quantitative view of multi-hazard risk is a frequency map, which aims to identify areas where risk of various hazards overlap. Figure 2 shows a map colorized with the number of times a specific hazard happens within a specific region or administrative level. When considering multiple hazards, a composite frequency index is calculated by normalized sum of the individual frequency components weighted by a single-hazard ranking measure. Modifications of this technique re-normalize by e.g. population density or vulnerability. This is a technique that can be used to identify (in a relative way) disaster hotspots by assuming that the number of times a disaster happened in the area in the past is representative of its occurrence in the future. This of course does not consider interrelations between hazards as well as trends from future projections if risks or the conditions around risk are dynamic. Also, uncertainties cannot be represented in such a description, while it can be used as a base to develop scenarios and inform policies.
Risk index methods
Index methods are an evolution of frequency maps, aiming to identify areas that are at risk of multiple types of hazards. These methods calculate a composite risk index across multiple dimensions, the most used being a combination of normalized indexes as hazard exposure and vulnerability. When multiple hazards are considered, these can be weighted by intensity, magnitude and frequency. The results of risk index methods are usually visualized as a color scale on a map.
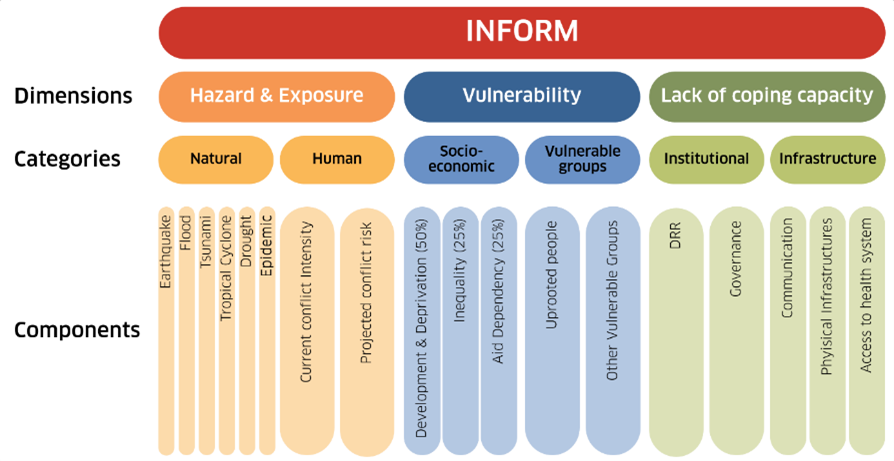
The INFORM index is one of such methodologies that calculates a normalized risk index for humanitarian crises based on composite indicators of vulnerability, exposure, and lack of coping capacity. It does not consider interactions between hazards but allows for layering other types of disasters than natural disasters, like for example conflict.
Probabilistic/Statistical techniques
Probabilistic approaches are based on the knowledge of the underlying distribution of variables describing the hazard to infer the likelihood of something happening with a certain degree of certainty. The knowledge of the distribution of variables is either inferred by historical data (non-parametric techniques) or by underlying theory of the physics of the events (parametric techniques). The correctness of the representation is as good as the knowledge of the underlying distributions. This means that for cascading events that have an underlying physical interconnection (as floods and landslides or droughts and wildfires, where one can be the physical driver of the other) this approach can be very powerful and fairly accurate. Less so when events do not have a clear correlation, or when there is not enough data available.
In case of historical data scarcity for independent hazards methodologies as information diffusion can be used to calculate the probability of exceedance of for a given parameter (e.g. loss of human life).
The results of a probabilistic risk model are normally presented in terms of standard metrics as ‘expected average loss over a period’ and ‘probability of exceeding a given (risk) threshold’. If the underlying variables can be specified at a granular level (e.g. using susceptibility maps) then a special probabilistic analysis is also possible.
2.2.2 Multi-hazard risk assessment
Recent literature warns that “ignoring interactions between important environmental and anthropogenic processes could distort management priorities, increase vulnerability to other spatially relevant hazards or underestimate disaster risk” (Gill & Malamud, 2016, p.659). Therefore, when interrelations between hazards are present, it is recommended to integrate these interactions into multi-hazard risk assessment. This can be done by studying the spatial temporal overlay of different hazards by using probabilistic methods to infer correlations between evens. However, compared to multi-layer single-hazard approaches, these methods are more complex, and their results are less straightforward to understand.
Statistical Modelling Methods
There are three main approaches to model interrelations between events: stochastic, empirical, and mechanistic (Figure 4). Each modelling approach has several sub-approaches.
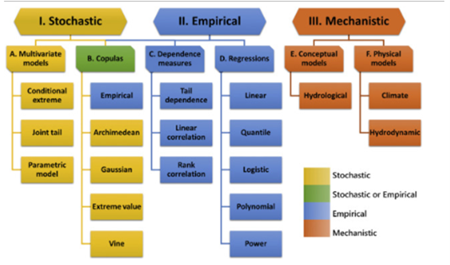
Stochastic models estimate the (joint) probability distribution of multiple (compounding) events by allowing for random variations in one or more of the input variables. A big advantage of these type of models is that they have the capacity to extrapolate beyond the range of input data. There are simpler and more complicated models, depending on how explicit the relation between couples of events is. Two families can be defined, multivariate and copula models, where copula models only model the dependence structure, while multivariate models also include modelling the distribution of each variable individually (also referred to as marginal modelling). Simply said, stochastic models are numerical simulations of events, and they can model beyond the available historical data.
Empirical models are based on observations and measurements. These models fit empirical distributions to the observations. A disadvantage compared to stochastic models is that empirical models are not capable to extrapolate beyond the available data, and thus require a lot of data. Empirical models can be divided into dependence measures and regressions. Dependence measures focus on the extent to which two or more variables are correlated. Regression measures what effect changes in one or more independent variables has on a dependent variable. Many diverse types of regression models exist. Regressions are mostly used when modelling cascading hazards, and the most widely used regression model are linear regressions.
Mechanistic models are optimized representations of phenomena based on the physical or otherwise rule based representation of the mechanism underlying the event. In the context of multi-hazard analysis, they are mostly used on water bodies, as fluid mechanics can be applied. They are a very powerful technique as it allows to extrapolate beyond the range of data and it allows a physical justification of the interactions between events within the realm of the assumptions made to exemplify the phenomena.
Probabilistic Graphical Models Technique
Probabilistic Graphical Models is a method that uses probabilities to calculate risk.
Event trees are used to graphically present a sequence of events that result from the initial disaster. They are represented as a process with binary outcomes. Probabilities of occurrence and the consequences of the events are used to calculate risk. Event trees are a useful quantitative method, incorporating the interconnection of hazards and probabilities of hazards. However, a drawback is that it can only be applied based on a single starting event.
BNs is another probabilistic model that can depict the cascading effects among hazards, due to its graphical structure. It is a combination of a qualitative and quantitative approach. The graphical aspect consists of nodes and arrows, the conditional probabilities make up the quantitative part. All possible interactions can be included in the assessment. Moreover, nodes in the model can continuously be updated whenever there is new evidence on interrelations between hazards. BNs are very promising methods in the modern multi-hazard fields. However, there are some drawbacks to using BNs. First, continuous data needs to be transformed to discrete data. Secondly, BNs cannot adopt feedback patterns and dynamic modelling can become devious, as natural phenomena change over time. To further improve BNs, the Hybrid Bayesian Network (HBN) and the Dynamic Bayesian Network (DBN) are developed. HBNs implement an algorithm so that the BN can handle both continuous and discrete data and DBNs are better equipped to deal with dynamic variables.
Machine learning techniques make use of computer algorithms which can improve their performance based on the (increasing) availability of (historical) data. Machine learning makes use of a training data set to make predictions. It is concerned with making the most accurate predictions or minimizing the error of a model. Usually, a data set is split into training and validation data. Most commonly, 70% of the dataset is used for training and 30% of the dataset is used for validation. There are many different types of machine learning models, many of which rely on combined applications of mostly statistical methodologies. These algorithms are applied in machine learning to be applied for prediction purposes. Machine learning methodologies are very powerful if we are in a data rich environment. In the context of multi-hazard risk analysis that would mean having a wealth of historical data on events and impacts, which is possible mostly in highly digitized contexts. Thus, they can be very powerful, but extensive data is necessary.
2.3 Semi-quantitative methodologies
Semi-quantitative methodologies use a mixed approach, with quantitative and qualitative elements to the analysis.
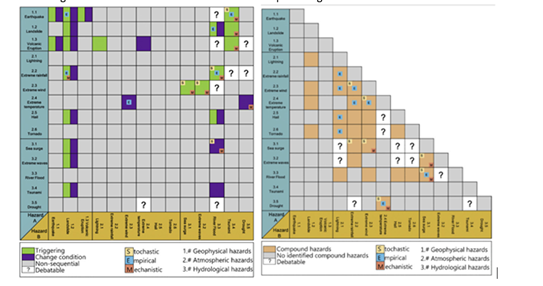
Hazard interaction matrix
One way to incorporate hazard interaction in multi-hazard risk assessment is the use of the interaction matrix method (IMM). Experts encode all possible relations among hazards into a matrix. Multi-hazard risk is then estimated by overlaying all spatial information consecutively. Figure 5 shows interaction matrices for compound and cascading risks separately. The interrelation matrices can be developed based on literature review and expert knowledge on the possible interactions between hazards.
Weighted overlay multi-hazard maps
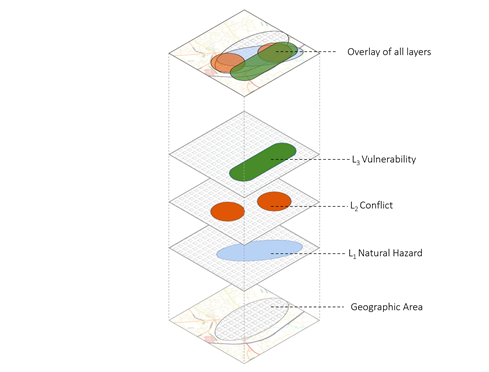
Weighted overlay is a methodology developed to extract insights from overlayed quantitative indexes weighted according to expert opinion. The methodology consists of a GIS spatial analysis of pre-existing vulnerability indicators, historical natural hazards exposure and historical conflict density. Each layer is re-classified to a 5-class ranking of risk from Low to Very high based on expert opinion. The sum of the layers is once again normalized to the range 1-5. The result produces a map highlighting vulnerable and multi-hazard areas, by showing the overlay of all layers in 5 classes. The areas of ‘Class 5’ (Very High) are the most relevant ones, as these are the geographic areas which are most affected by conflict and natural hazards and know very high vulnerability.
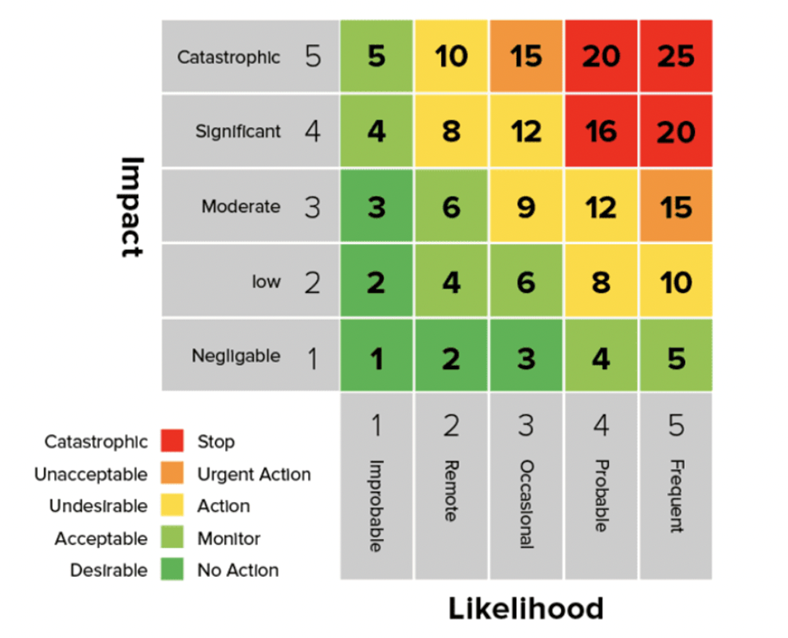
Risk heat maps
A risk heat map is a visual representation of risk data where the individual values within a matrix are represented as color that have a meaning. The risk map is a visualization of a risk matrix that contains the likelihood of an event versus the impact it will have on the system we are examining (people or other assets). The color associated with the specific matrix item is chosen on a scale of risk where risk is defined as impact multiplied by likelihood. It is possible to compare the likelihood of multiple hazards across different geographical areas and target population.
Way forward
Even though there is general agreement that disaster risk reduction needs to move from single to multi-hazard scenarios to get a comprehensive understanding of the area at risk, this does not mean it is considered an easy task. It is advisable to first understand the interrelations between the hazards before choosing a suitable methodology (or combination of methodologies) to conduct your multi-hazard risk analysis.
Further reading
- Delmonaco, G., Margottini, C., & Spizzichino, D. (2006). Report on new methodology for multi-risk assessment and the harmonisation of different natural risk maps.
- Dilley, M., Chen, R. S., Deichmann, U., Lerner-Lam, A. L., & Arnold, M. (2005). Natural Disaster Hotspots: A Global Risk Analysis (No. 5). World Bank, see here.
- Gill, J. C., & Malamud, B. D. (2014). Reviewing and visualizing the interactions of natural hazards. Reviews of Geophysics, 52(4), 680–722, see here.
- Gill, J. C., & Malamud, B. D. (2016). Hazard interactions and interaction networks (cascades) within multi-hazard methodologies. Earth System Dynamics, 7(3), 659–679, see here.
- Leonard, M., Westra, S., Phatak, A., Lambert, M., van den Hurk, B., McInnes, K., Risbey, J., Schuster, S., Jakob, D., & Stafford‐Smith, M. (2013). A compound event framework for understanding extreme impacts. WIREs Climate Change, 5(1), 113–128, see here.
- Marin-Ferrer, M., Vernaccini, L., & Poljansek, K. (2017). Index for Risk Management: INFORM Concept and Methodology Version 2017, see here.
- Nielsen, T. D., & Jensen, V. F. (2013). Bayesian Networks and Decision Graphs (Information Science and Statistics) (Corrected ed.). Springer.
- Pescaroli, G., & Alexander, D. (2018). Understanding Compound, Interconnected, Interacting, and Cascading Risks: A Holistic Framework. Risk Analysis, 38(11), 2245–2257, see here.
- Tilloy, A., Malamud, B. D., Winter, H., & Joly-Laugel, A. (2019). A review of quantification methodologies for multi-hazard interrelationships. Earth-Science Reviews, 196, 1–20, see here.
- Tsiplakidis, J., & Photis, Y. N. (2019). Multihazard Risk Assessment from Qualitative Methods to Bayesian Networks: Reviewing Recent Contributions and Exploring New Perspectives. In Geospatial Challenges in the 21st Century (pp. 401–429). Springer, see here.